Note
Go to the end to download the full example code
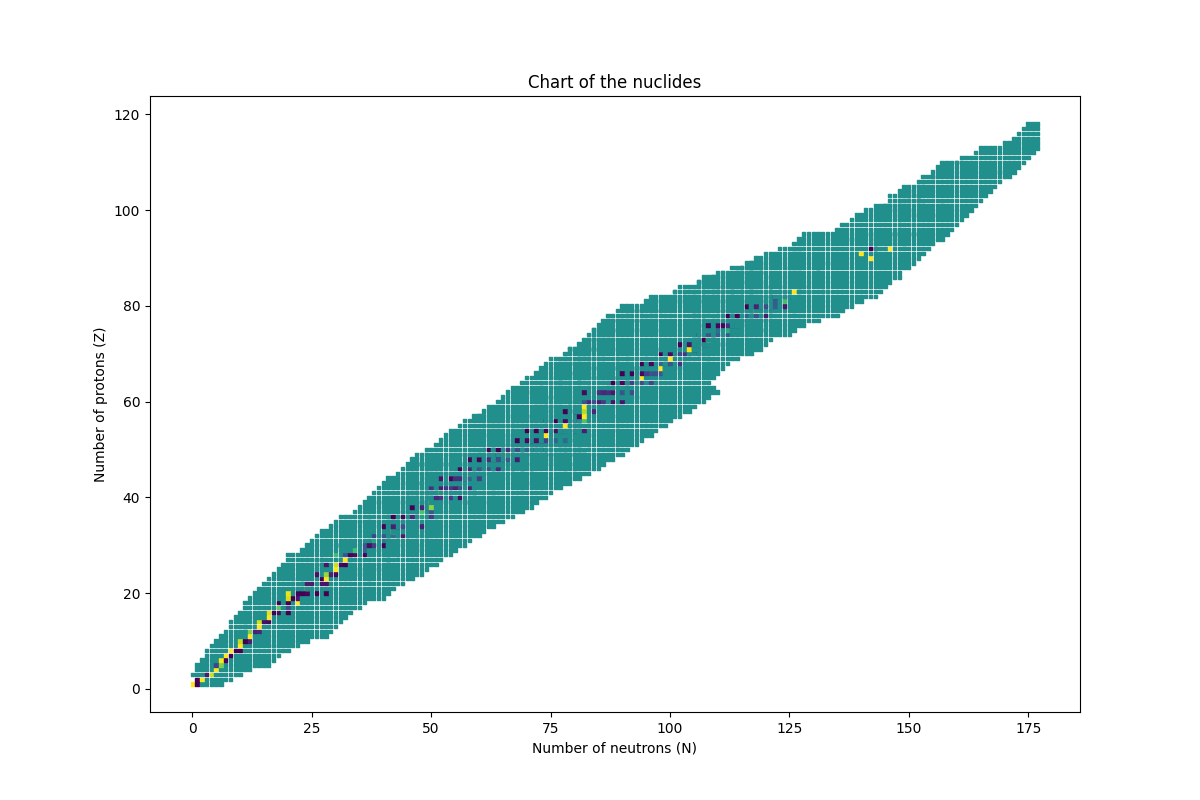
Plot a chart of the nuclides
Use the nuclide directory of ARMI to plot a chart of the nuclides coloring the squares with the natural abundance.
import matplotlib.pyplot as plt

from armi import configure
from armi.nucDirectory.nuclideBases import NuclideBases

configure(permissive=True)

xyc = []
for name, base in NuclideBases().byName.items():
    if not base.a:
        continue
    xyc.append((base.a - base.z, base.z, base.abundance or 0.5))

x, y, c = zip(*xyc)
plt.figure(figsize=(12, 8))
plt.scatter(x, y, c=c, marker="s", s=6)
plt.title("Chart of the nuclides")
plt.xlabel("Number of neutrons (N)")
plt.ylabel("Number of protons (Z)")
plt.show()
Total running time of the script: ( 0 minutes 0.265 seconds)