Note
Go to the end to download the full example code
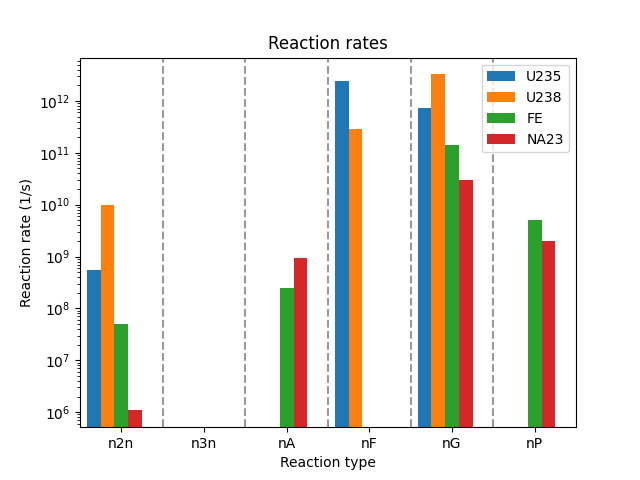
Computing Reaction Rates on a Block.
In this example, a set of 1-group reaction rates (in #/s) are evaluated for a dummy fuel block containing UZr fuel, HT9 structure, and sodium coolant. A dummy multigroup flux is applied.
This example also demonstrates how to build a reactor model from code alone rather than relying upon input files.
import matplotlib.pyplot as plt
import numpy as np

from armi import configure, settings
from armi.materials import HT9, Sodium, UZr
from armi.nuclearDataIO.cccc import isotxs
from armi.reactor import assemblies, blocks, geometry, grids, reactors
from armi.reactor.components import Circle, DerivedShape, Hexagon
from armi.reactor.flags import Flags
from armi.tests import ISOAA_PATH

configure(permissive=True)


def _addFlux(b):
    """Add dummy 33-group flux to the block."""
    # fmt: off
    b.p.mgFlux = [
        1.6e+11, 2.3e+12, 1.1e+13, 2.6e+13, 4.6e+13, 7.9e+13, 1.4e+14, 2.2e+14,
        2.3e+14, 2.7e+14, 2.2e+14, 1.7e+14, 1.3e+14, 1.4e+14, 7.5e+13, 3.2e+13,
        2.2e+13, 6.3e+12, 2.2e+13, 1.2e+13, 5.2e+12, 1.5e+12, 1.4e+12, 2.9e+11,
        7.4e+10, 5.5e+10, 1.9e+10, 5.0e+09, 3.6e+09, 8.8e+08, 4.3e+09, 1.3e+09,
        6.0e+08
    ]
    # fmt: on


def createDummyReactor():
    """
    Create a dummy reactor with a single fuel assembly and a single fuel block.

    Often, a reactor model like this is built directly from input files rather
    than from code as done here.
    """
    from armi.reactor.blueprints import Blueprints

    bp = Blueprints()
    cs = settings.Settings()

    r = reactors.Reactor("Reactor", bp)
    r.add(reactors.Core("Core"))
    r.core.spatialGrid = grids.HexGrid.fromPitch(1.0)
    r.core.spatialGrid.symmetry = geometry.SymmetryType(geometry.DomainType.THIRD_CORE, geometry.BoundaryType.PERIODIC)
    r.core.spatialGrid.geomType = geometry.GeomType.HEX
    r.core.spatialGrid.armiObject = r.core
    r.core.setOptionsFromCs(cs)

    # Create a single fuel assembly
    a = assemblies.HexAssembly("fuel assembly")
    a.spatialGrid = grids.AxialGrid.fromNCells(1)
    a.spatialLocator = r.core.spatialGrid[1, 0, 0]

    # Create a single fuel block
    b = blocks.HexBlock("fuel block")
    b.setType("fuel")

    # Create a single fuel component with UZr fuel.
    dims = {"Tinput": 20, "Thot": 900, "id": 0.0, "od": 2.9, "mult": 7}
    c = Circle("fuel", UZr(), **dims)
    b.add(c)

    # Create a single structure component with HT9.
    dims = {"Tinput": 20, "Thot": 600, "op": 16.0, "ip": 15.0, "mult": 1}
    c = Hexagon("structure", HT9(), **dims)
    b.add(c)

    # Fill in the rest of the block with sodium coolant.
    dims = {"Tinput": 600, "Thot": 600}
    c = DerivedShape("coolant", Sodium(), **dims)
    b.add(c)

    a.add(b)
    r.core.add(a)
    _addFlux(b)
    return r


# Create a dummy reactor with the function defined above.
r = createDummyReactor()

# Add an example cross section library to the reactor core
r.core.lib = isotxs.readBinary(ISOAA_PATH)

b = r.core.getFirstBlock(Flags.FUEL)
b.expandElementalToIsotopics(r.nuclideBases.byName["NA"])

# Iterate over a few nuclides/elements in the XS library
# and collect the total reaction rates in #/s.
allRates = []
nucNames = ["U235", "U238", "FE", "NA23"]
for nucName in nucNames:
    rateData = b.getReactionRates(nucName)
    rateLabels = sorted(rateData.keys())  # will be constant
    allRates.append([rateData[k] for k in rateLabels])

# plot the reaction rates as a bar graph
fig, ax = plt.subplots()
width = 1.0 / len(rateLabels)
offset = 0.0
for nucName, nucRates in zip(nucNames, allRates):
    ax.bar(
        np.arange(len(rateLabels)) + width + offset,
        nucRates,
        width=width,
        label=nucName,
    )
    offset += width

ax.set_xticks(np.arange(len(rateLabels)) + 0.5)
ax.set_xticklabels(rateLabels)

# Add little divider lines between reactions for clarity
for border in np.arange(len(rateLabels) - 1):
    ax.axvline(border + 1, ls="--", alpha=0.4, color="k")

ax.set_xlim([0, len(rateLabels)])

plt.yscale("log")
plt.legend()
plt.title("Reaction rates")
plt.xlabel("Reaction type")
plt.ylabel("Reaction rate (1/s)")
plt.show()
Total running time of the script: ( 0 minutes 0.716 seconds)