Note
Go to the end to download the full example code
Plotting a multi-group scatter matrix.
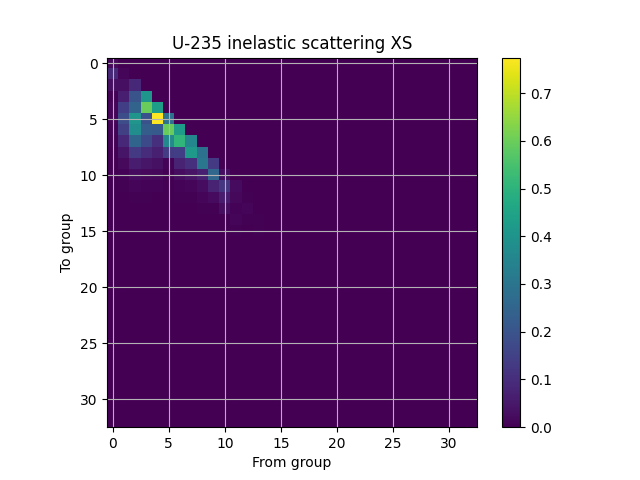
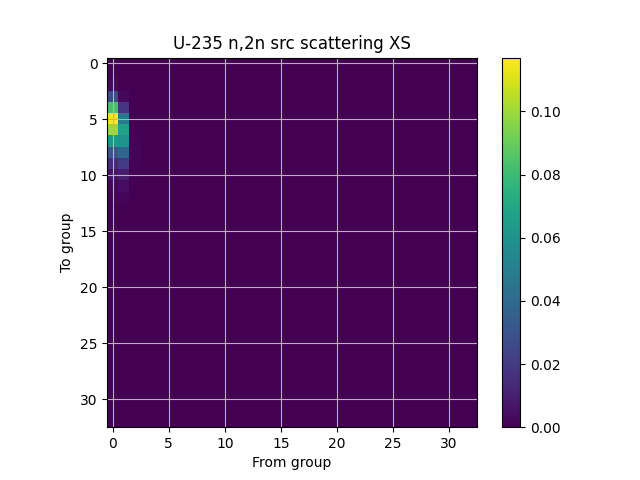
Here we plot scatter matrices from an ISOTXS microscopic cross section library. We plot the inelastic scatter cross section of U235 as well as the (n,2n) source matrix.
See Also: ISOTXS format.
import matplotlib.pyplot as plt

from armi import configure
from armi.nuclearDataIO import xsNuclides
from armi.nuclearDataIO.cccc import isotxs
from armi.tests import ISOAA_PATH

configure(permissive=True)

lib = isotxs.readBinary(ISOAA_PATH)

u235 = lib.getNuclide("U235", "AA")
xsNuclides.plotScatterMatrix(u235.micros.inelasticScatter, "U-235 inelastic")

plt.figure()
xsNuclides.plotScatterMatrix(u235.micros.n2nScatter, "U-235 n,2n src")
Total running time of the script: ( 0 minutes 0.338 seconds)

