Note
Click here to download the full example code
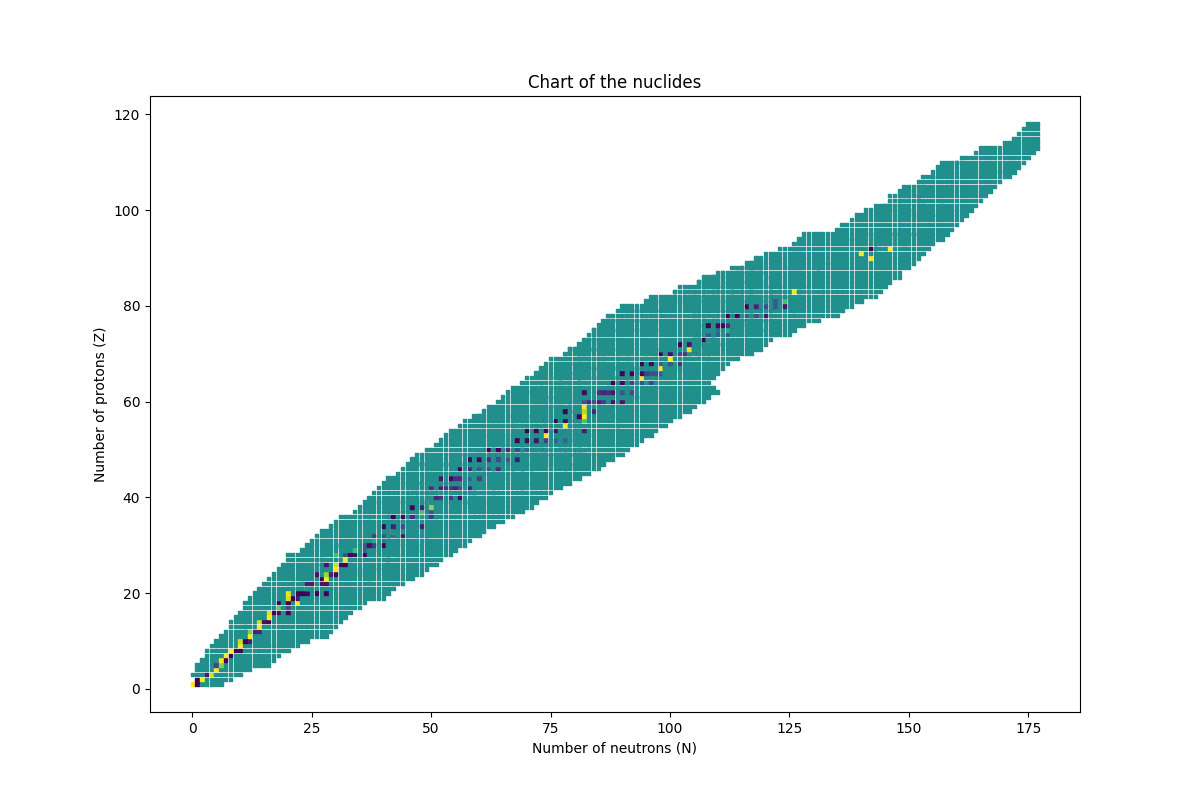
Plot a chart of the nuclides
Use the nuclide directory of ARMI to plot a chart of the nuclides coloring the squares with the natural abundance.
More details
Our extended tutorial for nuclides and
detailed nucDirectory docs may also be of interest.
import matplotlib.pyplot as plt

from armi.nucDirectory import nuclideBases
from armi import configure

configure(permissive=True)

xyc = []
for name, base in nuclideBases.byName.items():
    if not base.a:
        continue
    xyc.append((base.a - base.z, base.z, base.abundance or 0.5))
x, y, c = zip(*xyc)
plt.figure(figsize=(12, 8))
plt.scatter(x, y, c=c, marker="s", s=6)
plt.title("Chart of the nuclides")
plt.xlabel("Number of neutrons (N)")
plt.ylabel("Number of protons (Z)")
plt.show()
Total running time of the script: ( 0 minutes 0.175 seconds)