Note
Click here to download the full example code
Transmutation and decay reactions
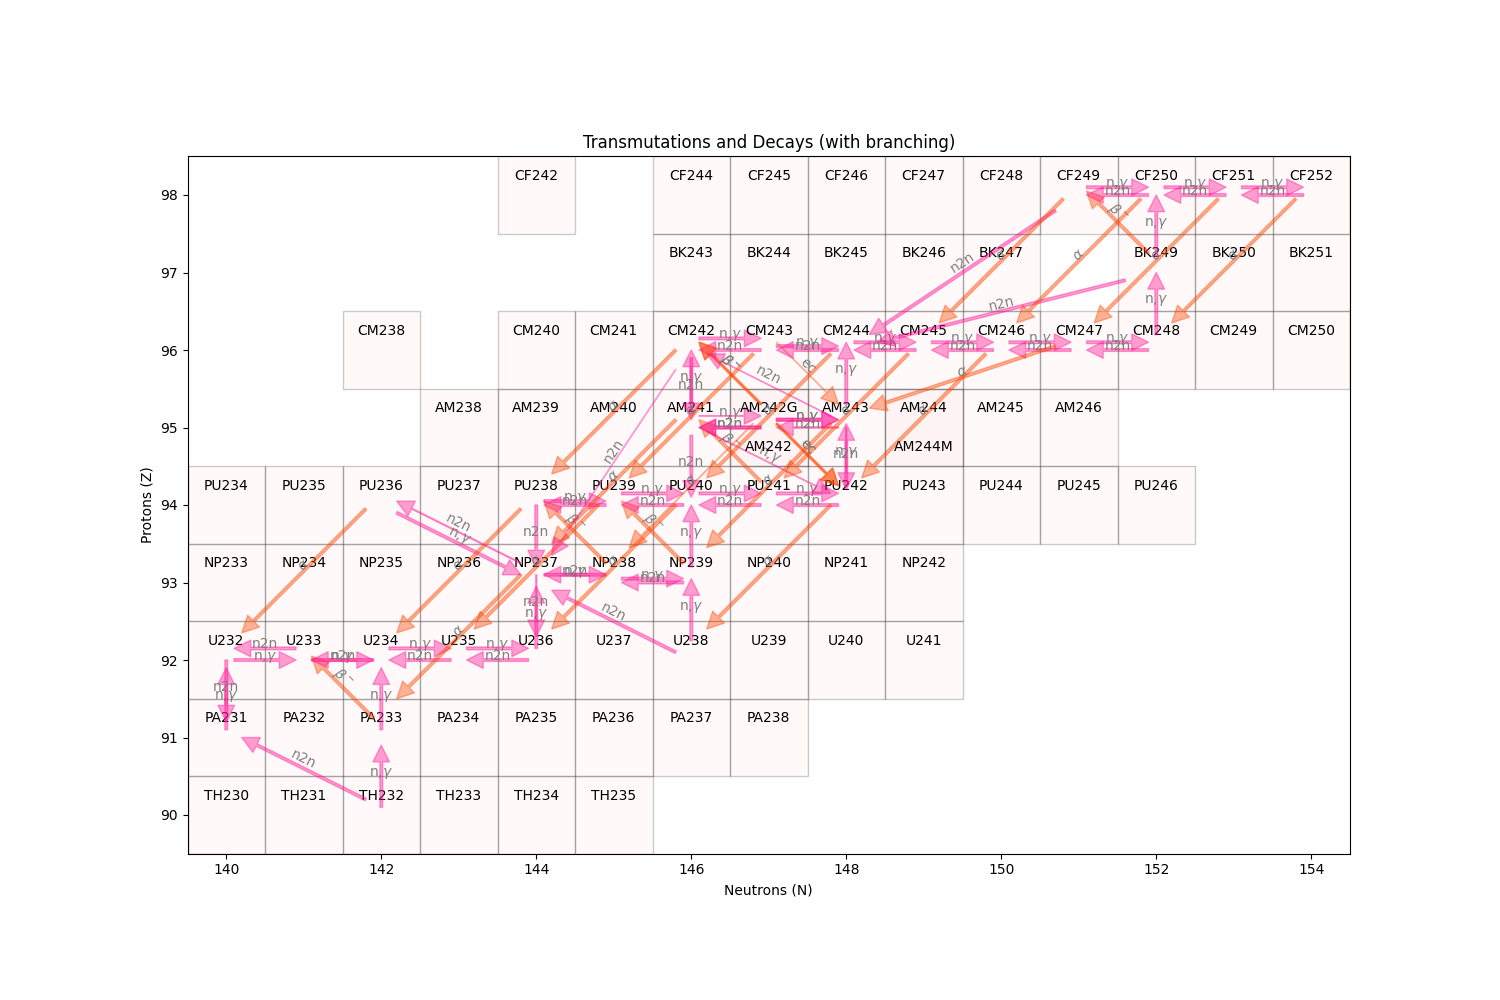
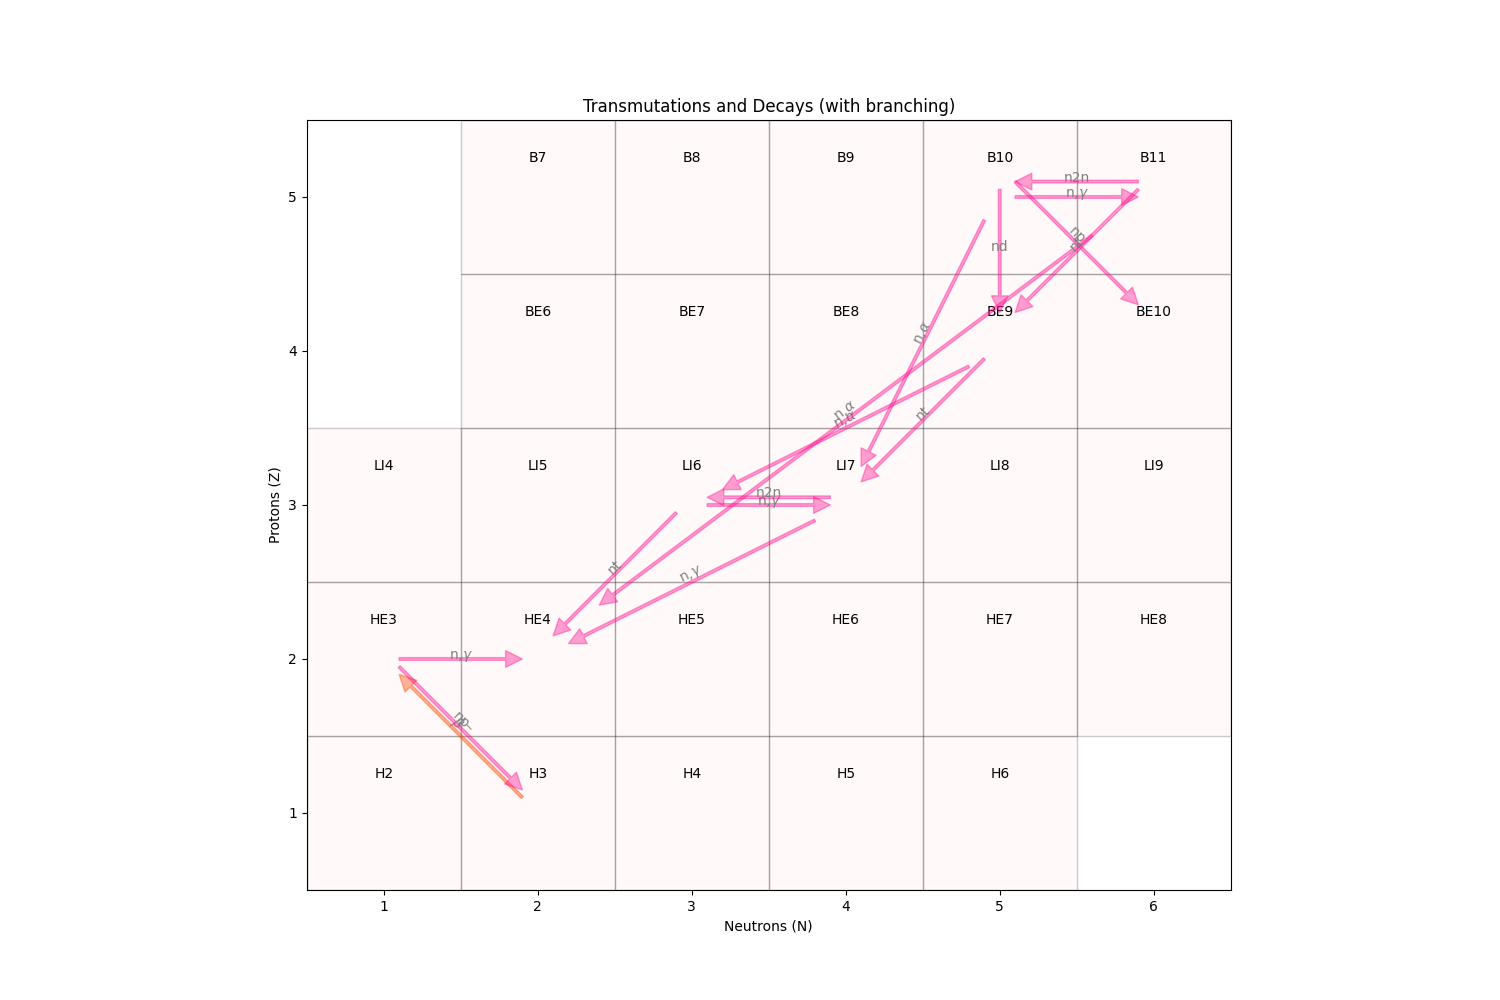
This plots some of the transmutation and decay pathways for the actinides and some light
nuclides using the burn chain definition that is included with ARMI. Note that many of
these reactions are shortcut for reactor analysis. For example, a U-238 capture goes
directly to NP-239 rather than first going to U-239. Some (n,2n) reactions quickly beta
decay, so the transmutation goes right to the product. For the decays, the arrow has been
adjusted in width based on the branching ratio. The transmutations are all constant since
their rates would depend on the neutron spectrum being modeled. This is mostly a demo of
more features of the armi.nucDirectory subpackage.
Users can input their own transmutation matrix or use this one.
A Bateman equation/matrix exponential solver is required to actually solve transmutation and decay problems, which can be provided via a plugin.
import os
import math

import matplotlib.patches as mpatch
from matplotlib.collections import PatchCollection
import matplotlib.pyplot as plt

from armi.context import RES
from armi.nucDirectory import nuclideBases


def plotNuc(nb, ax):
    """Make a square patch for a single nuclide base."""
    patch = mpatch.Rectangle((nb.a - nb.z - 0.5, nb.z - 0.5), 1.0, 1.0)
    rx, ry = patch.get_xy()
    cx = rx + patch.get_width() / 2.0
    # bump label down for metastable nuclides
    cy = ry + (3 - 2 * nb.state) * patch.get_height() / 4.0
    ax.annotate(
        nb.name,
        (cx, cy),
        color="k",
        weight="normal",
        fontsize=10,
        ha="center",
        va="center",
    )
    return patch


def plotAll(xlim, ylim):
    """Plot all nuclides and transformations."""
    # load the burn chain input that comes with ARMI
    with open(os.path.join(RES, "burn-chain.yaml")) as burnChainStream:
        nuclideBases.imposeBurnChain(burnChainStream)
    nbs = nuclideBases.instances
    fig, ax = plt.subplots(figsize=(15, 10))

    patches = []
    for nb in nbs:
        if not nb.trans and not nb.decays:
            # skip nuclides without any transmutations defined
            pass
        patch = plotNuc(nb, ax)
        patches.append(patch)
        # loop over all possible transmutations and decays and draw arrows
        for ti, trans in enumerate(nb.trans + nb.decays):
            product = nuclideBases.fromName(trans.productNuclides[0])
            if product.z == 0:
                # skip lumped fission products and DUMP nuclides
                continue
            # add index-based y-offset to minimize overlaps
            x, y, xp, yp = (
                nb.a - nb.z,
                nb.z + ti * 0.05,
                product.a - product.z,
                product.z + ti * 0.05,
            )
            if trans in nb.trans:
                color = "deeppink"
            else:
                color = "orangered"
            ax.annotate(
                "",
                (xp, yp),
                (x, y),
                arrowprops=dict(
                    width=2 * trans.branch, shrink=0.1, alpha=0.4, color=color
                ),
            )
            # add reaction label towards the middle of the arrow
            xlabel = xp - (xp - x) * 0.5
            ylabel = yp - (yp - y) * 0.5
            # pretty up the labels a bit with some LaTeX and rotations
            rxnType = (
                trans.type.replace("nGamma", r"n,$\gamma$")
                .replace("nalph", r"n,$\alpha$")
                .replace("ad", r"$\alpha$")
                .replace("bmd", r"$\beta^-$")
                .replace("bpd", r"$\beta^+$")
            )
            if xp != x:
                # rotate the nuclide type label to sit right on the arrow
                rotation = math.atan((yp - y) / (xp - x)) * 180 / math.pi
            else:
                rotation = 0
            ax.text(
                xlabel, ylabel, rxnType, color="grey", ha="center", rotation=rotation
            )

    pc = PatchCollection(patches, facecolor="mistyrose", alpha=0.2, edgecolor="black")
    ax.add_collection(pc)
    ax.set_xlim(xlim)
    ax.set_ylim(ylim)
    ax.set_aspect("equal")
    ax.set_xlabel("Neutrons (N)")
    ax.set_ylabel("Protons (Z)")
    ax.set_title("Transmutations and Decays (with branching)")
    plt.show()


if __name__ == "__main__":
    # make two plots, one zoomed on actinides and another on light nuclides
    plotAll(xlim=(139.5, 154.5), ylim=(89.5, 98.5))
    plotAll(xlim=(0.5, 6.5), ylim=(0.5, 5.5))
Total running time of the script: ( 0 minutes 3.528 seconds)

