7. Reports in ARMI
Note
The resulting report itself is an HTML page with table of contents on the left.
ARMI provides the ability to make a variety of plots and tables describing the state of the reactor. Also, with ARMI’s variety of plugins, some plots/analysis could be plugin dependent. If you have certain plugins installed, some new different plots may be available or more pertinent to the report.
From this understanding, a plugin hook is created called getReportContents(), which allows for this ability to get special contents from a specific plugin.
Currently it is implemented in the bookkeeping and neutronics plugin.
7.1. The Hook: getReportContents()
getReportContents takes in 5 arguments (r, cs, report, stage, blueprint)
|
a Reactor |
|
Case Settings |
|
the stage of the report you are collecting for Begin/BOL, Standard, End/EOL |
|
a blueprint for a reactor, and since not always provided, content is dependent on whether it has the value of None |
|
a ReportContent object. This is really where all report content is stored and the cornerstone of the workings of reports |
ReportContent, at its core, is a transient represention of the report itself (until it is fully collected and converted to an html page), so in the call to getReportContents() additions are made to this object. Generally, you would want to break up the added contents into stages within the function getReportContents() as so:
>>> if stage == ReportStage.Begin:
>>>     newReportUtils.createGeneralReportContent(cs, r, report, blueprint, stage)
>>>     if blueprint is not None:
>>>         newReportUtils.blueprintContent(r, cs, report, blueprint)
>>> elif stage == ReportStage.End:
>>>     newReportUtils.getEndOfLifeContent(r, report)
>>> return
In this way, Begin things are general and not time dependent and if blueprint is available additional contents are made.
Things like TimeSeries (Graphs) would want to be accessed at every stage that getReportContents() is called (so they can add a point for every time),
so one can imagine the functionality of the below to allow for Standard additions.:
>>> if stage == ReportStage.Standard:
>>>     neutronicsPlotting(reports, etc, ...)
ReportContent acts as a dicionary of Section’s behind the scenes and the further description of these objects will be found in the following topics.
7.2. What is ReportContent?
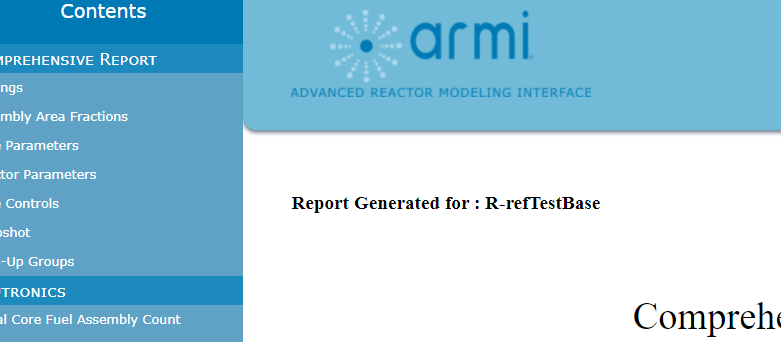
At the start of any report creation, creation of the ReportContent object is key. ReportContent when created, needs the name of the reactor for the title of the report.
To do so, one could do the following:
>>> report = ReportContent(r.name)
The resulting use of this content to generate the title on the html page:
ReportContent itself has a dicionary (.sections), and so functionality inherent to dictionaries also exists for ReportContent.
Instead of having to directly access the dictionary working behind the scenes through report.sections["Design"], one can instead just
directly call report["Design"], since __get__() has been implemented.
A major component of the ReportContent class is the function to writeReports(). This converts our dictionary/Section/Table/TimeSeries content into an html page for viewing.
Overall, the important functionality examples for ReportContent additions are summarized below.
7.3. Sections
The first level of ReportContent’s is made up of Section’s. Section’s have a title, and themselves a dictionary of contents (.childContents),
but again the ability to just directly access a sections children like report[Comprehensive][Setting] exists, as long as the section already exists,
(if not, a key error persists, and so it is safer to do report[Comprehensive].get(Setting, Table(...))), where Table would be the default.
Sections can be made of other Sections, Tables, Images, TimeSeries, or Htmltree Elements (for the purpose of directly writing prose).
Each time a Section is written, it’s title will be a heading above the enclosed content and it will have a reference in the html page tied to this heading.
Again, the ability to add different plugins content to the same section exists.
The following demonstrates how to add elements to the same Section through a call to addChildElement(item, heading)
report["Design"]["Block Diagrams"].addChildElement(Image("Diagram of {} Block at Cold Temperature".format(
                        bDesign.name.capitalize()
                    ),
                    fileName,
                    "{}".format(bDesign.name.capitalize()),
                ),
                bDesign.name.capitalize(),
            )
It is also possible to do the following through dictionary access for the same result
report["Design"]["Block Diagrams"][bDesign.name.capitalize()](Image("Diagram of {} Block at Cold Temperature".format(
                    bDesign.name.capitalize()
                ),
                fileName,
                "{}".format(bDesign.name.capitalize()),
            ))
7.4. Tables
Making sure a Table isn’t already created is important. Due to the repeated call to getReportContents() at different cycles/nodes of the
reactor life cycle, some sections may have already been called before, and we want to be careful about not overwriting a Table/TimeSeries.
(most Image’s may only be called at a single time and not dependent on multiple plugins, so those cases have less to worry about at this time)
A general workflow to combat the issue of potentially overwriting the table is to ensure that it exists in a get or default type call.
The get() function implemented in Section works perfectly for this:
>>> currentTable = report["Comprehensive"].get("Settings", Table("Settings Table", "General Overview))
>>> # If Comprehensive is not created as a Section yet, it will be (based on how the inner workings of __get__ defined within ReportContents works)
>>> # and Settings will be a table added to Comprehensive.
Now, once you have the current table, you may add a row to it with addRow()
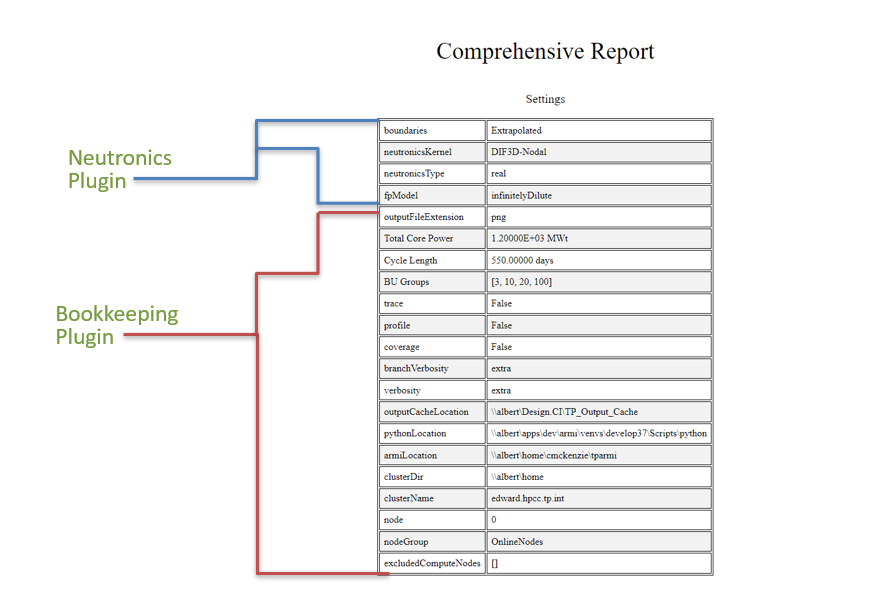
An example of this in action in two distinct plugins (Neutronics and Bookkeeping) below is meant to outline the ability to add to the same table from different plugins.
Suppose in Bookkeeping a Table is accessed with the following code:
>>> section = report[COMPREHENSIVE_REPORT]
>>> tableList = section.get(SETTINGS, newReports.Table("Settings", "General overview of the run"))
>>> tableList.addRow(["outputFileExtension", cs["outputFileExtension"]])
>>> tableList.addRow(["Total Core Power", "%8.5E MWt" % (cs["power"] / 1.0e6)])
>>> if not cs["cycleLengths"]:
>>>     tableList.addRow(["Cycle Length", "%8.5f days" % cs["cycleLength"]])
>>> tableList.addRow(["BU Groups", str(cs["buGroups"])])
Similarily that same Table is accessed within Neutronics for additional settings additions:
>>> section = report[newReportUtils.COMPREHENSIVE_REPORT]
>>> table = section.get(newReportUtils.SETTINGS, newReports.Table("Settings", "Overview of the Run"))
>>> for key in [CONF_BOUNDARIES, CONF_NEUTRONICS_KERNEL, CONF_NEUTRONICS_TYPE, CONF_FP_MODEL]:
>>>    table.addRow([key, cs[key]])
The result (with some additional Bookkeeping additions) is outlined in this image
Note
If a Table is only having additions made within one plugin and never accessed again (only happens at BOL or EOL),the opportunity to do the following exists:
>>> report[COMPREHENSIVE_REPORT][ASSEMBLY_AREA] = newReports.Table("Assembly Area Fractions (of First Fuel Block)",
>>>        header=["Component", "Area (cm<sup>2</sup>)", "Fraction"],
>>>    )
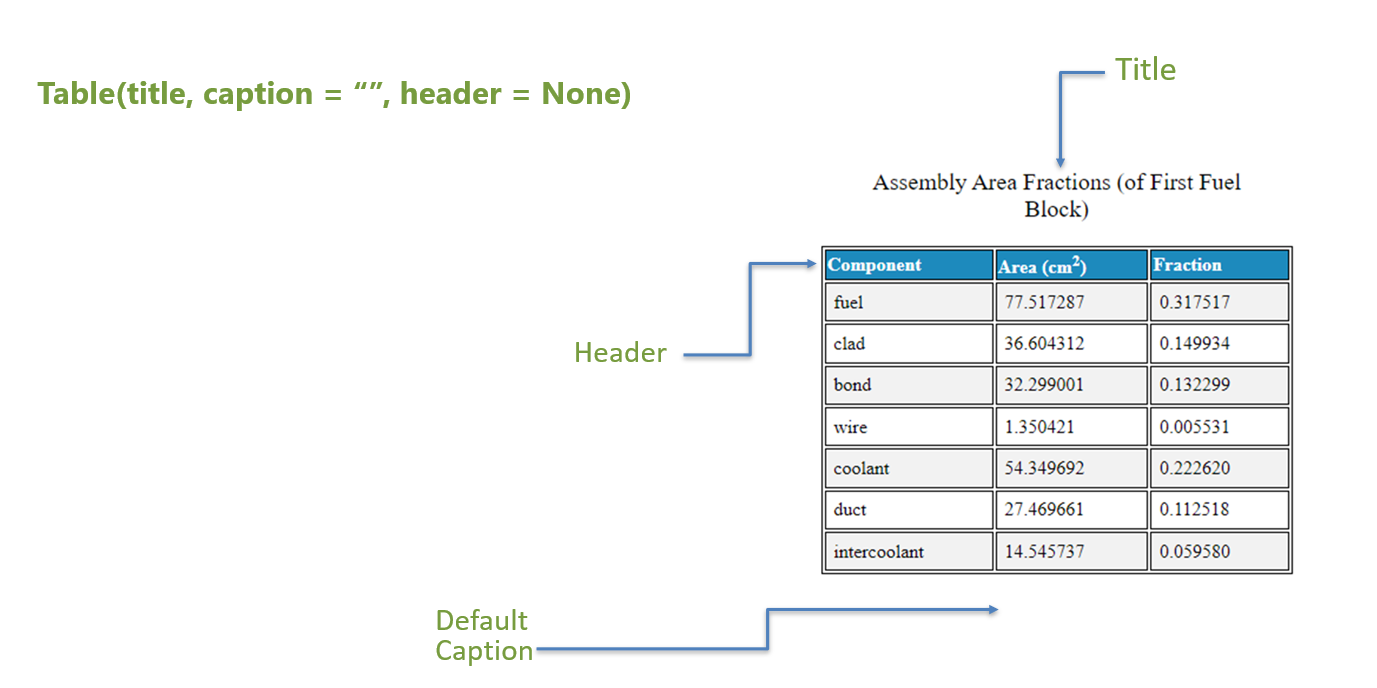
This is because there is no worry for Table overwrite if a Table is only accessed in one plugin and not time dependent. So, something like Assembly Area Fractions, or other general Design things that you would want to insert from beginning of reactor life.
The general layout of this corresponding to the html output is
7.5. Images
Images may generally be things to add at stage = Beg, or stage = End. (For example, a core map at BOL would be inserted at stage = Beg)
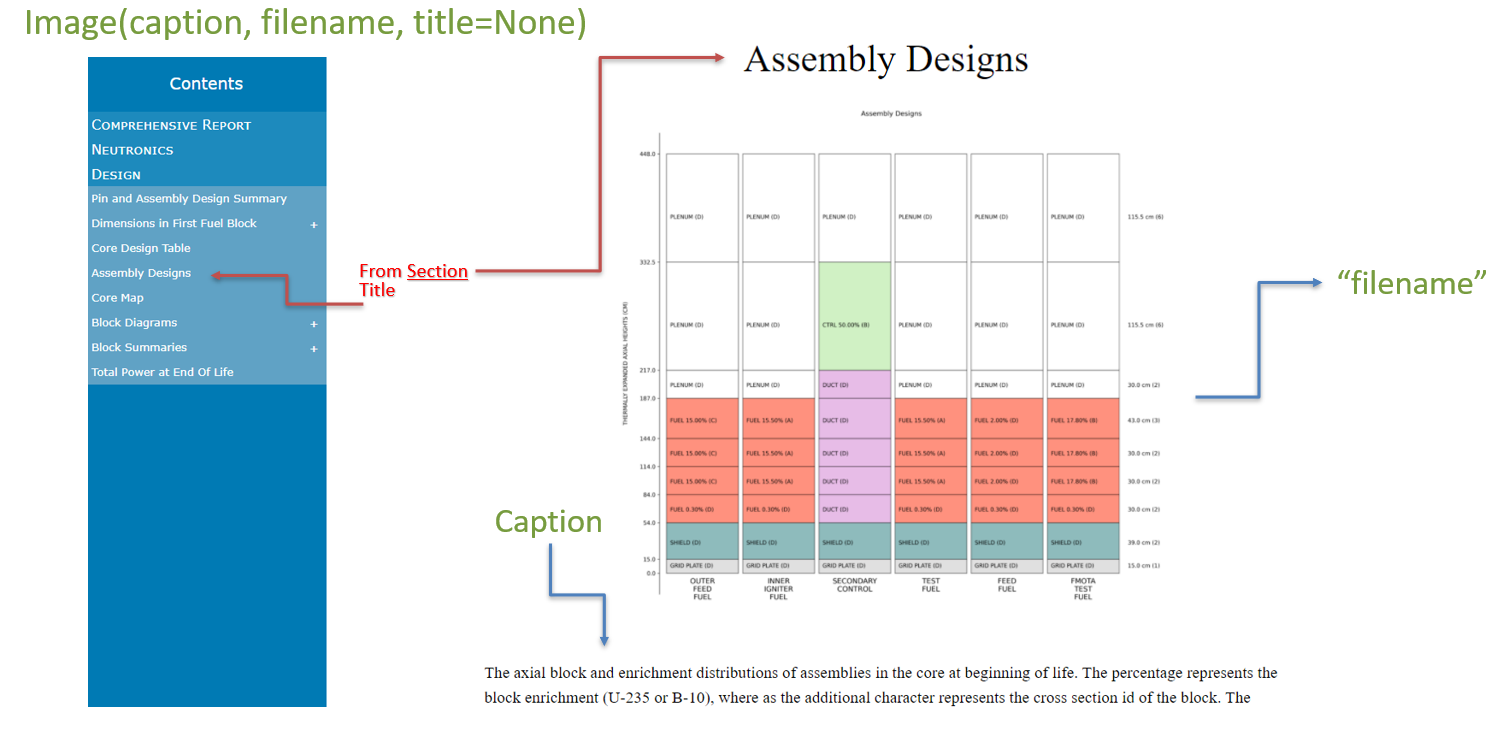
Images require a caption and a filename and have an optional title argument. (They would also have a call to another function before hand to create the image file (for example))
The title on an Image is defaulted to None. This is a decision to deal with some images where maybe it is best to group them together, but overdoing it if
each were to be given a title. Title in general has the sole purpose of giving this image a position within the table of contents one the left of the html
page. Without title, it will not have a +/- sign for additional drop down reference. If you want to specify an image, give it a caption and mention its name.
There are two examples of additions of images within sections worth mentioning.
Here is an example for adding Assembly Designs Images (where images are grouped but don’t have distinct titles, and no direct access, Title is defaulted to None)
Here is an example for Block Images (in which table of content access was wanted, so title was given)
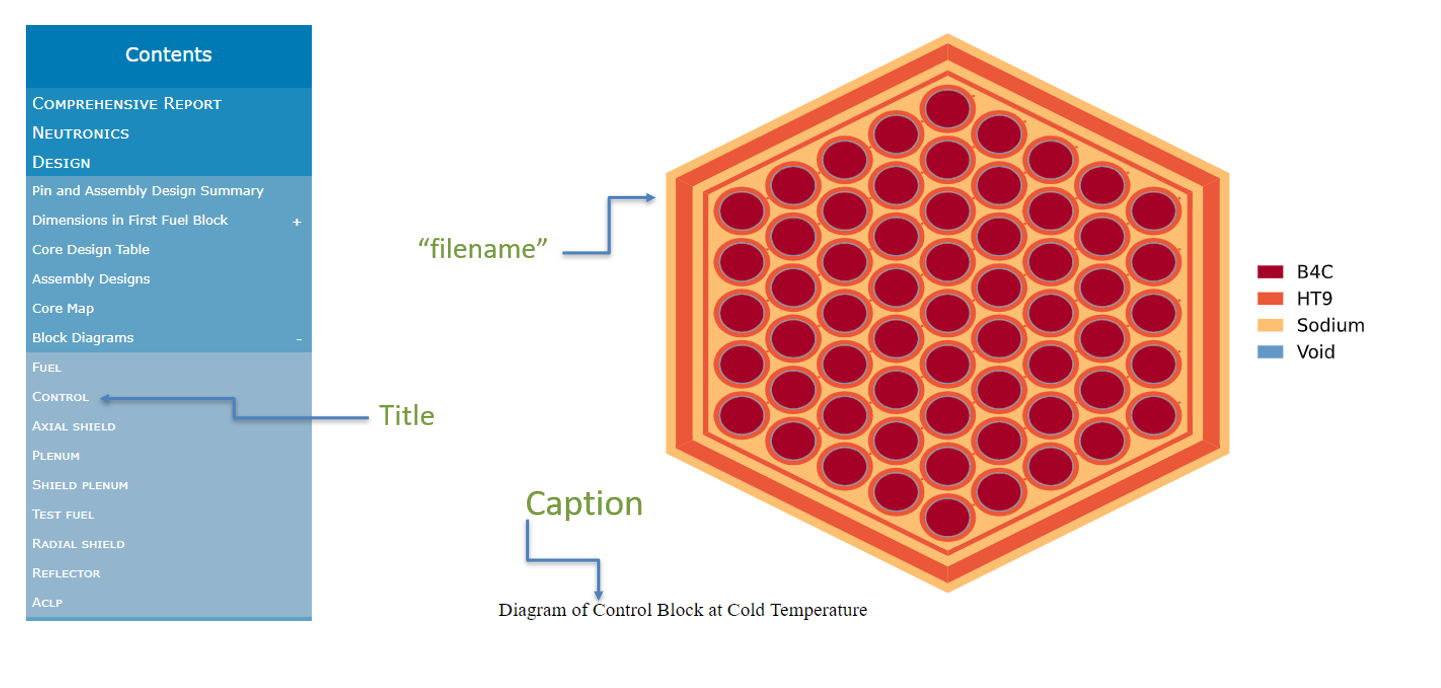
In this case, Block Diagrams is the Section Title, and it is expandable, for easy viewing of distinct blocks.
7.6. TimeSeries
This is where information for later graphing is collected. The TimeSeries contains many elements. A title a rname (reactor name), labels list, yaxis title, and filename.
Like Table, these objects need to have a check on whether they already exist. In this case, you could just check and create the object when stage is set to Begin (and then when stage is Standard always know it exists to add content to),
but for good measure, you may also just check if the Plot already exists in the Section, and if not, add it.
- Here is code for adding to a K-effective plot::
>>> # Make K-Effective Plot
>>> labels = ["k-effective"]
>>> neutronicsSection = report[reportConstants.NEUTRONICS_SECTION]
>>> if reportConstants.KEFF_PLOT not in neutronicsSection:
>>>    report[reportConstants.NEUTRONICS_SECTION][
>>>        reportConstants.KEFF_PLOT
>>>    ] = newReports.TimeSeries(
>>>        "Plot of K-Effective",
>>>        r.name,
>>>        labels,
>>>        "K-eff value",
>>>        "keff." + cs["outputFileExtension"],
>>>    )
>>>    # To create the keff section and start populating it's points...
>>> report[reportConstants.NEUTRONICS_SECTION][reportConstants.KEFF_PLOT].add(
    labels[0], r.p.time, r.core.p.keff, r.core.p.keffUnc
>>> )
Here, only one label exists, so we only add one line for label[0]. There are further examples of this in the docstring of TimeSeries for information on adding multiple lines.
In summary, to add multiple lines (say, for different assembly types on a Peak DPA plot), the label would be the assembly type and the data would be the dpa at the time for that type.
The uncertainty value –> which in general denotes an error bar on the graph—> would be None or 0, for each point if there is no uncertainty.
7.7. HTML Elements
One may also want to add just plain prose. To do this, Sections also allow for the addition of htmltree elements so you can add paragraphs, divs, etc, as outlined in htmltree. These parts however will not be titled unless wrapped within a Section, and similarily will not have a direct link in the table of contents without a Section wrap as well (due to their inherent lack of title). However, thier addition may add beneficial information to reports in between Tables and Images that could prove useful to the user and any readers.
7.8. Summary
ReportContent is made up of many different types of elements (Sections, Tables, Images, HtmlElements, TimeSeries), that when
writeReports() is called on the ReportContent object, have the ability to be rendered through their render() method in order to be translated
to html for the resulting document. This document is saved in a new folder titled reportsOutputFiles.